In August, Toronto’s housing market faced shifting dynamics with signs of stabilization amid ongoing challenges. While prices and rents continued to adjust, changes in listings, construction trends, and affordability are shaping the market’s future.
Off Course: Toronto’s Market in Search of Direction


Key Developments
In August, Toronto’s housing market showed signs of stabilization due to a decline in new listings, while the rental market weakened with rent prices nearing 2022 levels. Despite low new construction sales, housing starts and completions remained strong, with completions reaching a historic high. At the same time, lower inflation expectations and reduced premiums led to a drop in mortgage rates, boosting affordability, which was offset by rising unemployment and mortgage arrears.
No Improvement in Sales Activity So Far
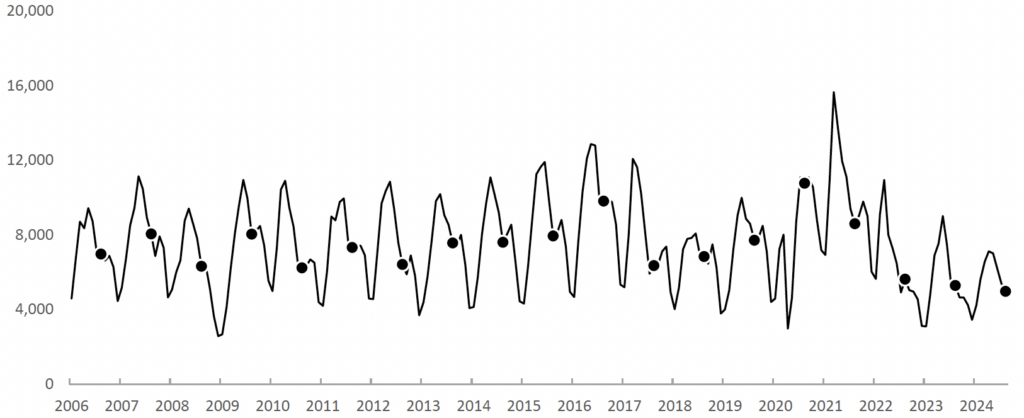
In August, sales in the Toronto metro area continued to weaken, a trend typical for this month. Sales declined by 8% month-over-month but showed a slight increase after seasonal adjustment. They were also 6% lower than last year’s levels and 35% below the 10-year average. The total of 4,975 sales marked the lowest reading for this month since at least 2006.
New Listings Activity Declined
New listing activity declined in August, both nominally and after seasonal adjustment. The number of new listings dropped by 23% compared to the previous month, rose by 2% year-over-year and was 1% above the 10-year average. The total of 12,547 new listings was among the highest for this month since at least 2006, excluding the pandemic period.
Active Inventory Remained the Highest Since 2008
Active inventory declined in August but continued to rise after seasonal adjustment. It shrank by 5% month-over-month, grew by 46% year-over-year, and was 53% above the 10-year average. Typically, active inventory increases slightly in September before declining for the remainder of the year.
Real Estate Market Weakened
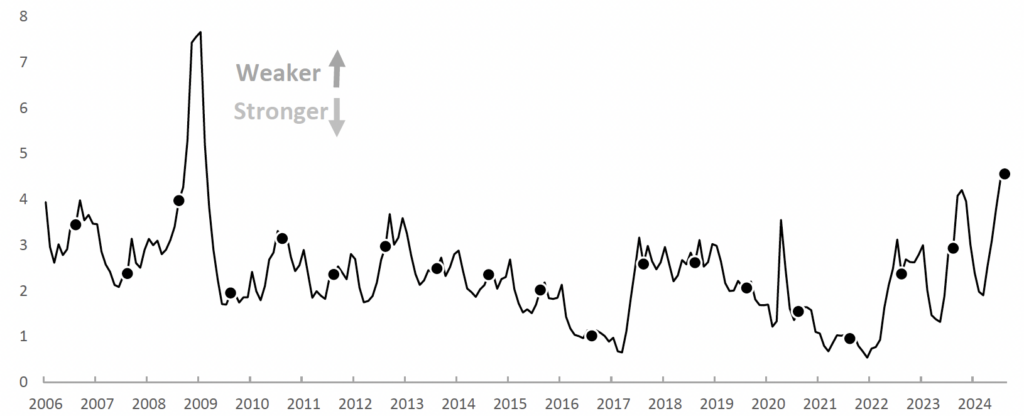
The market balance indicator, Months of Inventory, weakened further in August, reaching its worst level for this month since at least 2006. It was 2.1 times higher than the 10-year average, with condos remaining the weakest sector. Historical data suggests that prices typically decline at a rate of 7% per year based on this reading, with the overall market generally softening toward the end of the year.
The latest reading of another market balance indicator, the Sales-to-New Listings ratio, was also the weakest for August since at least 2006. It was 35% below the 10-year average, with historical data suggesting an annual price decline of 11% based on this reading.
Prices Continued to Decline
All price metrics declined in August, with the typical property valued at $1,082,200. Prices were down 1-5% compared to last year and were 19-23% below the peak values of 2022. Given the current weakness in market balance indicators, further price declines are expected in the near term. However, an uptick could occur due to seasonal strength in September and October.
The Rental Market Weakened During its Traditionally Strongest Month
The Toronto Metro rental market slightly weakened in August, which is unexpected as this month typically represents the peak of seasonal strength. The market balance was the weakest this month since at least 2012, excluding the pandemic period. Historically, the rental market tends to soften significantly toward the end of the year.
The Average Rent Price Was Slightly Above the 2022 Level
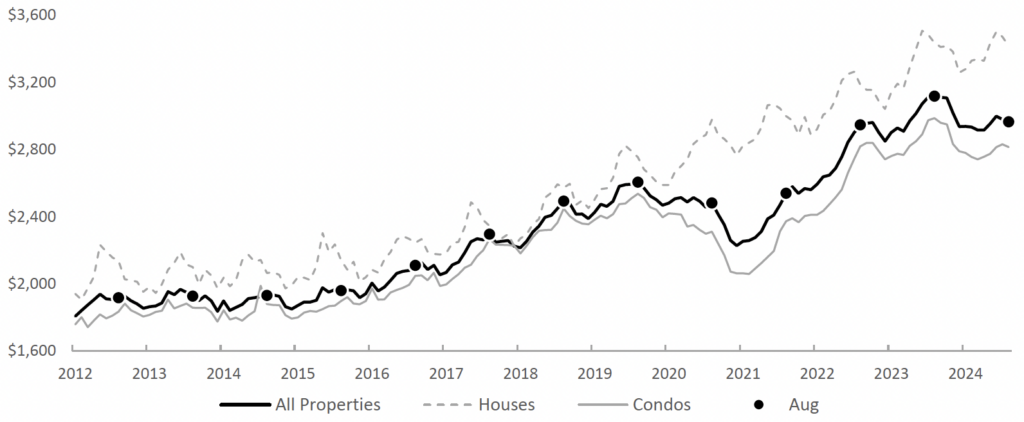
The average rent price in the Toronto Metro area declined slightly in August to $2,965. This is unusual for this time of year, as rent prices typically increase between December and August. Compared to the previous year, the average rent was down by 5.8% and was only 0.6% above the 2022 level.
New Construction Sales Were Record Low
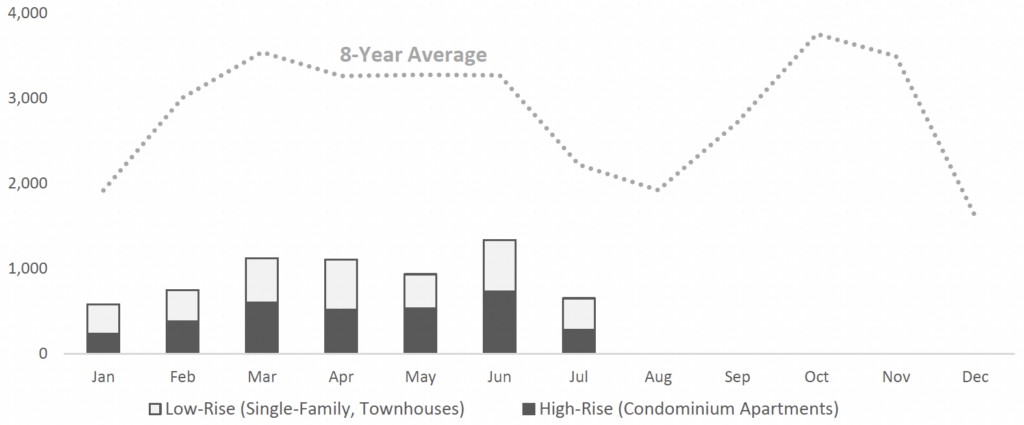
In July, new construction sales were 71% below the 8-year average. Over the past twelve months, sales totalled 13,206, reflecting a 61% decrease from the historical average. This also represents the lowest number since at least 2016.
New Construction Prices Remained Stable
The new high-rise benchmark price was $1,020,179 in July, reflecting a monthly decline of 0.3%, a yearly decrease of 6%, and a 19% drop from the peak. Additionally, the new low-rise benchmark price was $1,585,881, showing a monthly decline of 1.7%, a yearly decrease of 5%, and an 18% drop from the peak value.
Housing Starts Surged
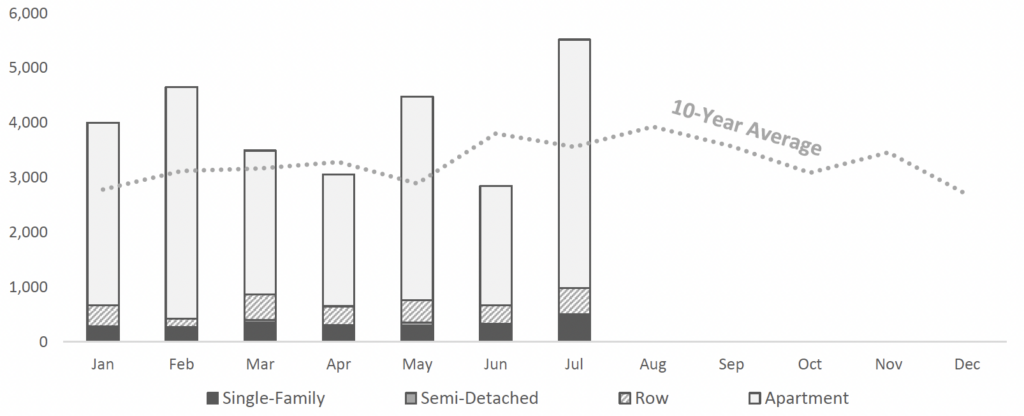
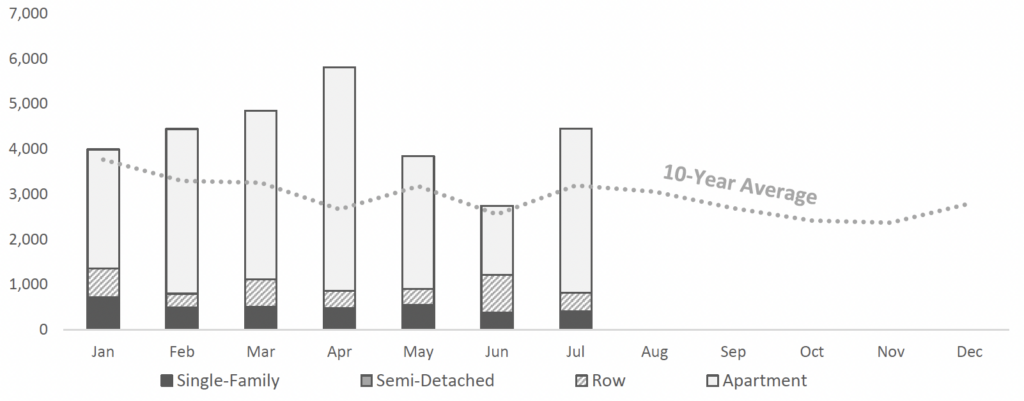
Housing starts surged in July, reaching a level 55% above the 10-year average. Over the past twelve months, construction has been started on 44,512 units in the Toronto Metro area, representing a 13% increase from the historical average.
New Record: Over 50,000 Units Completed in the Last 12 Months
In July, housing completions were 39% above the 10-year average. Over the past 12 months, 50,474 units were completed in the Toronto Metro area, representing a 42% increase from the historical norm. This is also the highest number of completions recorded since at least 1972, surpassing the previous record of 49,750 set last month.
Mortgage Rates Declined Further
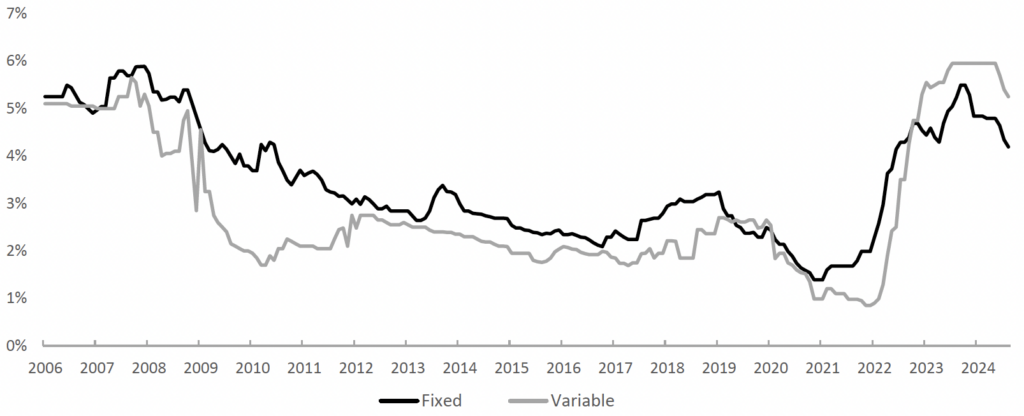
A decline in the bond market’s inflation expectations and a reduction in premiums led to a decrease in both fixed and variable mortgage rates in August. The lowest 5-year fixed mortgage rate fell by 0.15% to 4.19%, while the lowest 5-year variable mortgage rate also dropped by 0.15% to 5.25%
Housing Affordability Continued to Improve
A decline in the Toronto Metro benchmark price and mortgage rates led to further improvements in housing affordability in August. It now requires 57% of a typical household’s income to cover mortgage payments for a newly purchased property in Toronto Metro, down from the previously observed 59%.
Labour Market Weakened
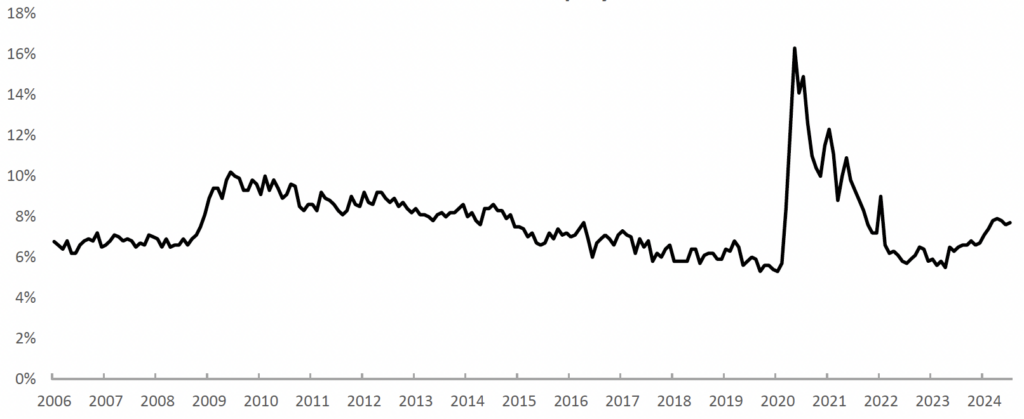
The unemployment rate in the Toronto Metro area increased in July, from 7.6% to 7.7%. This represents an 18% increase compared to the previous year and is 5% above the 10-year average. Meanwhile, the national unemployment rate remained unchanged at 6.4%, which is 3% below the 10-year average.
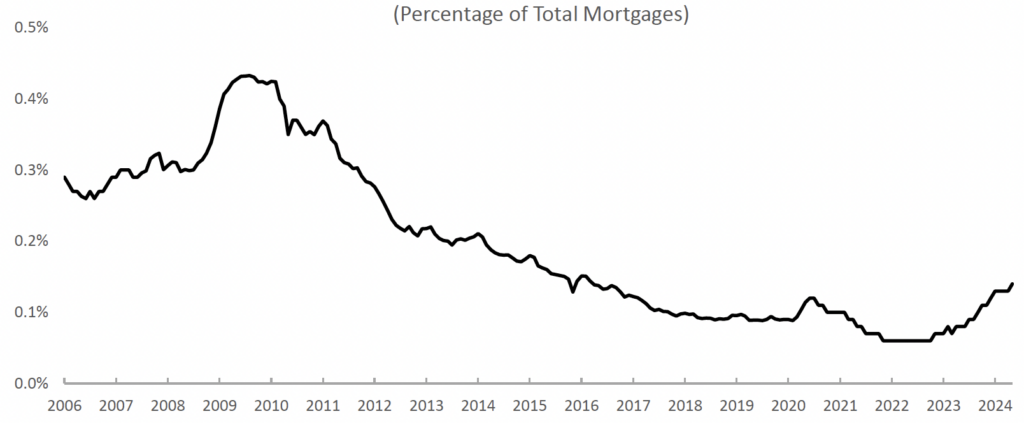
Mortgage Arrears Increased Slightly
The mortgage arrears rate in Ontario rose from 0.13% to 1.14% in May, reflecting a 75% increase compared to the previous year and 30% above the 10-year average. Meanwhile, the national mortgage arrears rate increased from 0.18% to 0.19%, marking a 27% increase from the previous year and remaining 16% below the 10-year average.
THE TAKEAWAY
In August, Toronto Metro’s sales remained low, and new listing activity declined. Despite these factors, active inventory continued to increase on a seasonally adjusted basis, leading to a weakening of the market balance. However, the pace of this weakening slowed substantially compared to the previous month, indicating some signs of market stabilization. All price metrics declined in August, and while there may be a seasonal bump in prices in September-October, the weak market balance suggests that prices are likely to continue declining. The rental market also weakened in August, which is unusual for this time of year. It is expected to continue weakening towards the end of the year, partly due to strong seasonal factors. Rent prices declined further, nearly reaching 2022 levels.
New construction sales were 61% below typical levels in July, with activity over the past 12 months being the weakest since at least 2016. Despite low sales, new construction starts surged to a level 55% above the 10-year average. Housing completions remain strong, with the number of units completed over the last 12 months in the Toronto Metro exceeding 50,000 units for the first time in history.
Due to lower bond yields and a decline in premiums, both fixed and variable mortgage rates decreased in August. Combined with lower house prices, this led to an improvement in housing affordability. At the same time, both the unemployment rate and mortgage arrears increased slightly.
